» Description
One of my courses during the master studies was geoinformatics. Hm, how can I describe geoinformatics with a single sentence? Without being too accurate: Everything behind services like Google Maps or OpenStreetMap, and more :D
During the course, we learned all the fundamentals, for example how GPS works. Another topic is the many geographic reference systems and projections. There are so many, mainly because there isn’t a perfect solution to map a kind of a globe onto a 2-dimensional picture, thus for several use-cases, there are other approaches to deal with the distortions. For example, the often used Mercator projection enlarges the areas in Europe and shrinks areas near the equator.
The course assignment consisted of two parts:
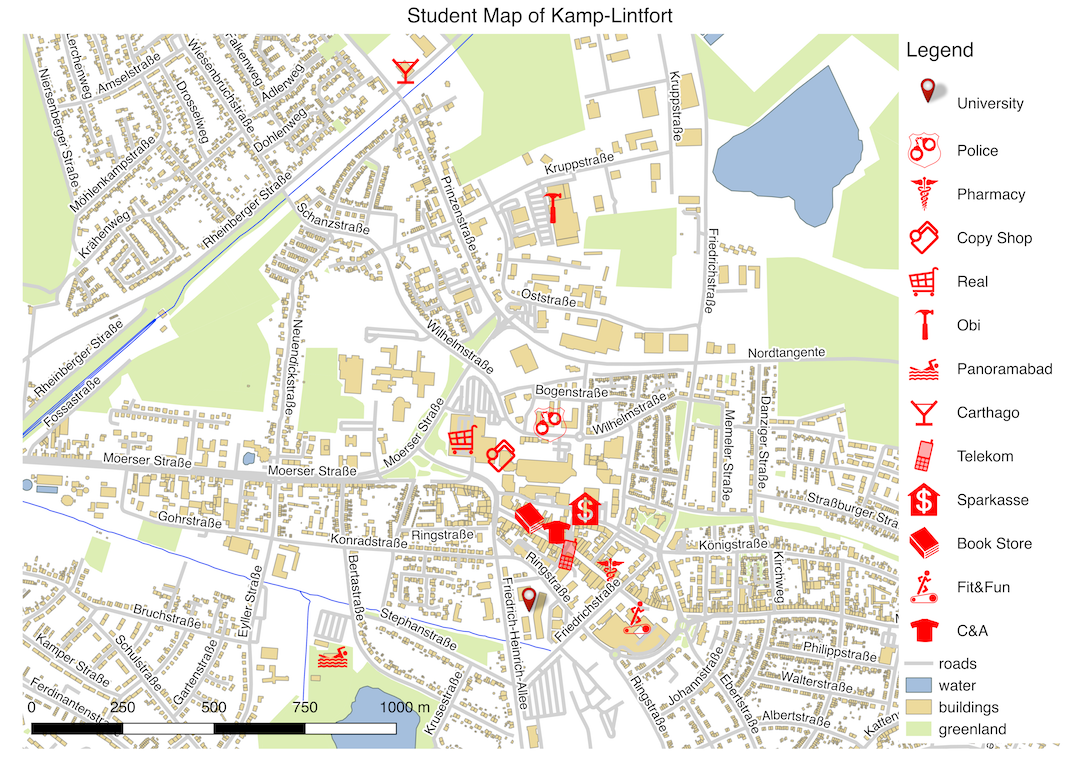
- Creating a map for students with several points of interests.
- Loading satellite data to classify the health of the area.
For the implementation, we used the open-source tool QGIS. The result of the first exercise is shown in the image at top of this site, and I was quite satisfied with the result. The main information was loaded from OpenStreetMap, but you have to visualize the data manually, and this takes some time. The biggest mistake you can do is to use too many colors which overwhelm the user.
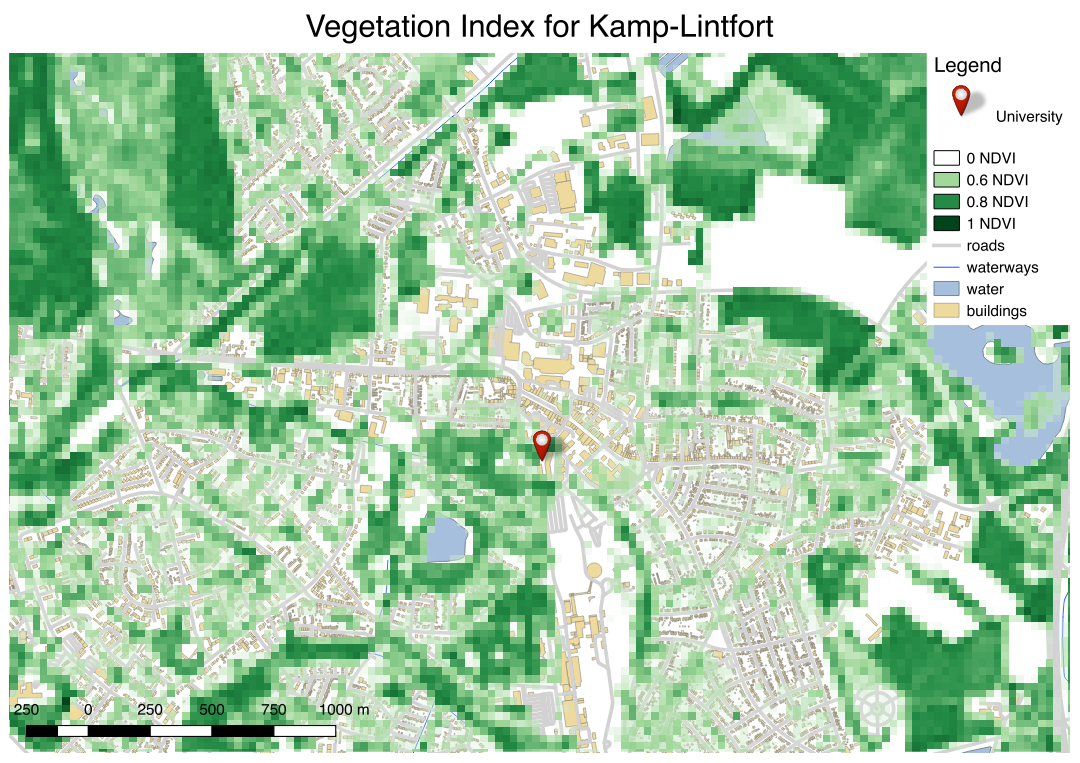
For the second part, satellite sensor data from a NASA satellite was loaded and I was able to show the vegetation. Unfortunately, the available data was in a low resolution but for an overview, it works.
» The good
I learned a lot of stuff, it was very interesting and I think it is a very complex topic when you have to deal with coordinates and different projection mappings. All used tools and information (QGIS, OpenStreetMap data, NASA satellite data) were freely available, which is really great.
» The bad
I really appreciate the work done by QGIS, it is probably the best freely available geoinformation system. Unfortunately, it was kind of buggy when I used it on macOS.
» Technologies used
- QGIS
(This post was written in February 2018. The project was finished in February 2017 and the date of this post was set accordingly, to have a correct chronological order of all projects.)